
On nominal output per resident, Canada fell beneath Mississippi in 2025, placing a G7 country below all fifty states. The statistic has limits, but weak productivity, underinvestment and policy failures make the broader decline impossible to dismiss.
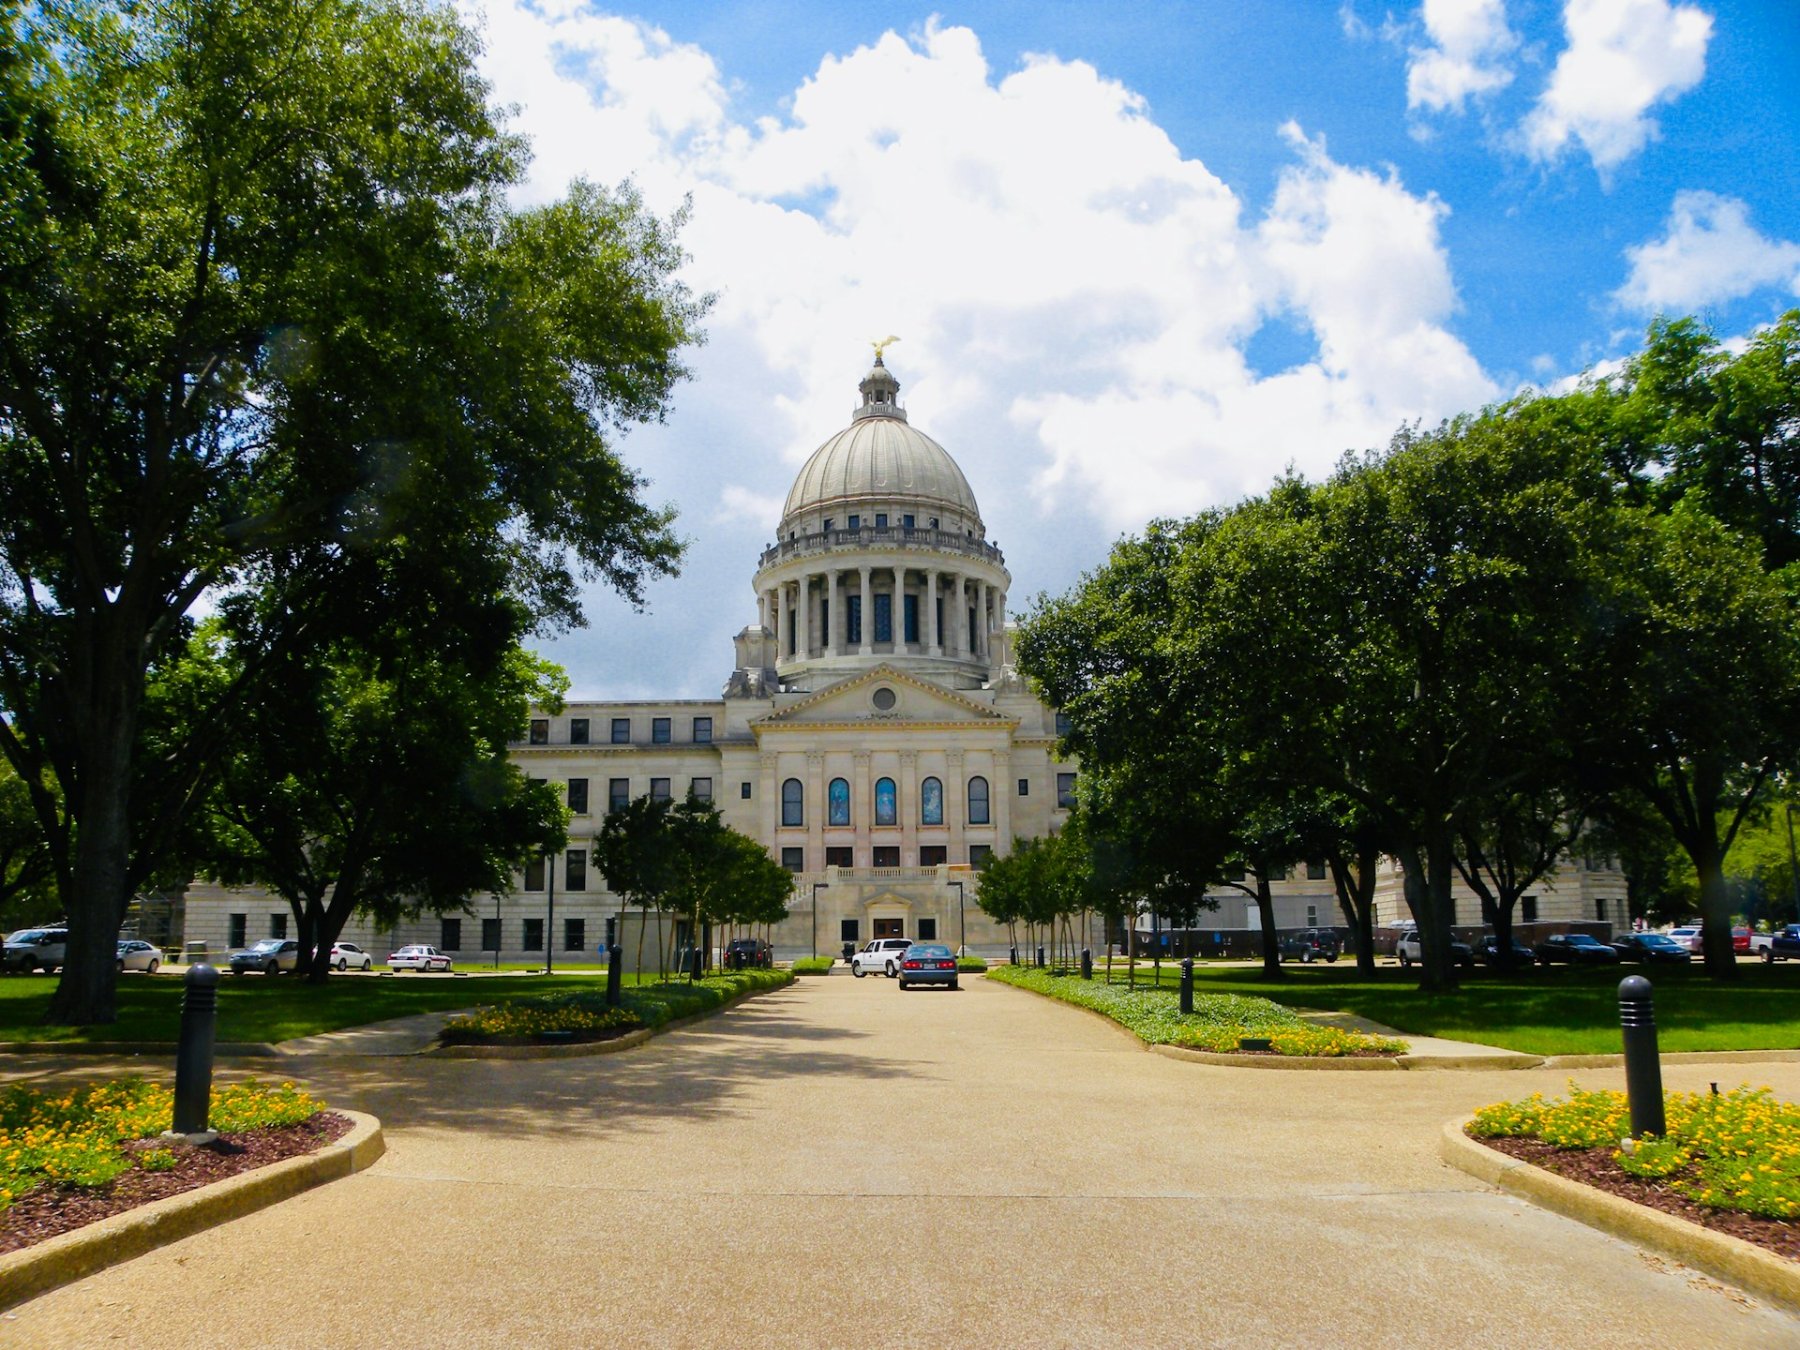
Canada's 2025 nominal GDP per capita was $55,698 USD, Mississippi's was $55,877 USD, a figure derived from current-dollar Bureau of Economic Analysis state GDP divided by the Census Bureau's 2025 population estimate. Mississippi has the lowest nominal GDP per resident of any U.S. state. By this calculation, Canada sat below it. A G7 country with immense natural resources now produces less per resident, in current U.S. dollars, than every single American state.
The Canadian figure comes from World Bank country data. Both numbers are nominal, reflecting market exchange rates rather than what a dollar actually buys in each place. This is not an official combined ranking; it is a comparison of two differently constructed statistical systems.
That distinction matters. It also does not dispose of the comparison, because more stable measures point in the same direction. GDP per capita measures production, not median income, household wealth or quality of life. A weaker loonie shrinks Canadian output when converted to U.S. dollars even if nothing changes at home.
On purchasing-power parity, which adjusts for domestic price levels, Canada sat slightly above the OECD average as of the most recent comparable data in 2023. PPP does not produce a direct adjusted comparison with Mississippi. These caveats do not erase what happened underneath.
The Structural Record
Statistics Canada's own comparative analysis is blunt. By the third quarter of 2025, Canada's real GDP per capita relative to the United States was 14 per cent below its position in early 1997. Canada's relative labour productivity had deteriorated by approximately 26 per cent over the same period. These are indexed ratios measuring how far Canada fell behind, not absolute Canadian contractions.
Between 1997 and 2025, Canadian labour productivity grew at an annualized rate of 1.22 per cent. The American rate was 2.22 per cent, almost one full percentage point higher. Compounded across a generation, that gap rewrites the economic map.
The divergence sharpened after 2015. From 1997 to 2015, real GDP per capita grew at nearly identical rates in both countries, 1.53 per cent in Canada and 1.52 per cent in the United States. After 2015, Canadian GDP growth slowed while population growth accelerated. Total output continued to expand, but Canadian output per resident grew substantially more slowly than in the United States.
Most Canadians could not have told you the exact year the lines crossed. But plenty noticed the symptoms: the coworker who left for Austin, the rent increase that no raise could match, the growing sense that working harder was not producing a proportionally better life.
Business investment adds to the stock of machinery, software and structures available to workers. By spring 2025, non-residential business investment per person was almost 9 per cent below its pre-COVID baseline. When investment per person remains depressed, firms have a harder time equipping workers to produce more value per hour.
Rapid population growth made weak per-capita performance more visible because productive capacity, housing and infrastructure did not expand at the same pace. The PBO's assessment of the subsequently reduced immigration targets illustrates the arithmetic. Relative to the previous policy trajectory, it estimated that the lower targets would leave total real GDP 1.7 per cent lower but real GDP per capita 1.4 per cent higher by 2027. The PBO cautioned that the demographic projection carried uncertainty. That is a forward-looking model, not necessarily a decomposition of past growth, but it demonstrates the difference between expanding the economy and increasing output per resident.
Immigration itself was not the failure. The failure was setting the pace of population growth without adequately aligning housing, infrastructure and productive investment. The federal government controlled the targets; provinces, municipalities and businesses controlled many of the systems that failed to expand alongside them.
The Bank of Canada has warned that stronger productivity is necessary for faster growth and sustainably higher wages without additional inflation. Provincial internal-trade barriers still fragment a country smaller in economic terms than California. Municipal zoning restrictions slowed housing construction for years.
What Canadians Feel
Aggregate numbers land differently at the household level. The OECD Employment Outlook found that Canadian real wages in the first quarter of 2025 remained 1.4 per cent below where they stood in early 2021, even after a 1.9 per cent year-over-year recovery. Wages were moving in the right direction, but from a hole inflation had dug.

Statistics Canada's distributional household accounts showed average consumption expenditures for middle-income households rising 4.2 per cent year over year in the third quarter of 2025, while average disposable income rose 0.7 per cent. Average net saving fell 56.6 per cent. Because the expenditure figures are not presented as inflation-adjusted consumption volumes, they show pressure on household finances rather than a comparable increase in what families could buy.
Anyone tracking their own household budget recognizes the pattern: the grocery bill climbs, the insurance renewal arrives higher, and the paycheque for some barely moves. The figures are consistent with households drawing down their financial buffer as expenses rose faster than income.
High shelter costs and weak real-income growth leave households with less room for saving, mobility and discretionary spending. Slow productivity growth also limits the economy's capacity to raise wages and fund expanding public services over time. The external purchasing power stings every time a Canadian crosses the border to shop, travel or compete for talent.
Two Futures
The near-term outlook does not promise rescue. The PBO projected total real GDP growth of 1.1 per cent in 2026 and 1.6 per cent in 2027. The Bank of Canada's July 2026 outlook expected total growth of 1.8 per cent in 2027 and 2028. These are forecasts for total output, not output per resident. Neither guarantees a rapid recovery in per-capita living standards.
Under continued drift, modest total growth persists while per-person gains stay weak. The wage gap with the United States widens. Housing costs may continue to delay family formation. Skilled workers weigh better-paid options across the border, and governments face harsher trade-offs between taxes, services and debt.
Under serious reform, the scenario changes. If Canada accelerates productive investment and major-project approvals, removes internal-trade barriers, aligns housing and infrastructure with population policy, strengthens competition, and improves commercialization of Canadian research, higher productivity creates more room for sustainable real-wage growth. If investment per person remains depressed and productivity growth stays near 1.2 per cent while the American rate remains almost one percentage point higher, the gap widens on terms no currency swing can disguise.
There is something unsettling about watching a country with this much talent, land and ambition measure its output per person against the lowest-output-per-resident state in its neighbour. A currency move or a data revision may erase a $179 USD gap. Neither will erase a generation of weaker productivity growth. That is the structural problem the ranking made visible, and the one Canada has yet to solve.